Sandy Fielden (RBN Energy)
Last month the Energy Information Administration (EIA) debuted a new monthly report detailing oil and gas drilling productivity in six of the largest US production basins. Rather than just being an “after the fact” report telling us what happened in the past, the new report provides a forecast of oil and gas production for the current and next month out in each of the six basins. The initial report indicates that oil production will increase by roughly 60 Mb/d in these basins during November with gas production increasing by 0.4 Bcf/d. The report also highlights continued improvement in rig productivity. Today we begin a series interpreting the new drilling rig productivity data.
We have previously described rapidly increasing US natural gas production from shale as well as oil production from shale and other tight resources. Recent U.S. crude and gas growth has centered largely in a few key regions and has been driven by advances in the application of horizontal drilling and hydraulic fracturing technologies. The growth in production has been accompanied by improvements in drilling productivity - described in our six part series on drilling economics. In fact drilling productivity is driving domestic production to such an extent that the EIA has developed a new approach to measuring it.
The EIA Drilling Productivity Report (DPR) provides region-specific insights into rig efficiency, new well productivity, decline rates at previously existing wells, and overall production trends. The report covers six regions (see map below). In 2011-12, these six regions accounted for 90 percent of domestic oil production growth and virtually all domestic natural gas production growth.

We will look at some of the regional data in the report in future episodes in this series but this time we have compiled two tables that summarize the production and rig productivity data provided in the report.
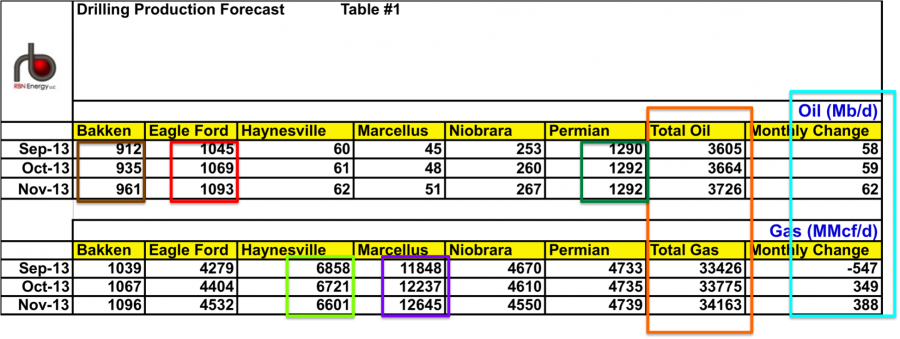
Table #1 below shows a summary of the production forecast data in the initial report for October 2013. The table is divided into two parts – the top half is for oil and the bottom half is for gas. Taking the oil data first, there are 8 column headings – one each for the production basins, a total column (orange box) and a monthly change column (light blue box). For each basin the table has three months worth of data extracted from the DPR. The data shows estimated monthly oil production in Mb/d for each basin that the EIA forecast. The forecast is based on prior month well data published by State agencies, current and prior month well drilling counts and average production from new and existing wells. Because production data reported by states can be significantly lagged, DPR uses rig count data along with trends in drilling productivity to make estimates of oil and gas production where data are not yet available. Since existing EIA monthly production reports have a three month lag the information in the DPR is more current than previously available – although likely subject to adjustment. The DPR provides history back to 2007.

The bottom half of Table #1 shows the identical summary for natural gas production in the six basins in MMcf/d. The total gas production in the six basins is expected to reach 34.2 Bcf/d in November – up 0.4 Bcf/d from October (Total Gas column). The two largest gas basins are the Marcellus (purple box) and the Haynesville (light green box) – with the former expected to produce 12.6 Bcf/d in November 2013 – just under double the Haynesville estimate of 6.6 Bcf/d (note the data in the table is in MMcf/d). Natural gas production in the Permian and Eagle Ford basins is higher than the Bakken because the former have more infrastructure to deliver associated gas from oil production to market .

The new DPR report provides a compelling gauge of US oil and gas drilling productivity in a more timely form than we have previously had access to. The data shows production continues to increase in the main shale and tight oil basins. Much of the improvement is due to drilling efficiency and new well productivity, rather than an increase in the number of active rigs. In the next episode in this series we will look more closely at the data provided for specific basins as well as the impact of older declining production on the overall trends.
The EIA Drilling Productivity Report (DPR) provides region-specific insights into rig efficiency, new well productivity, decline rates at previously existing wells, and overall production trends. The report covers six regions (see map below). In 2011-12, these six regions accounted for 90 percent of domestic oil production growth and virtually all domestic natural gas production growth.

Source: EIA (Click to Enlarge)
The DPR estimates the current rate of growth or decline in production in each of these basins based on a number of indicators. These include the active rig count, drilling efficiency as well as the productivity of new wells, and production and depletion trends for previously producing wells. The data is intended to be more informative than traditional indicators such as simple oil and gas rig counts. The report also estimates rig productivity - a new measure that EIA has developed to better reflect continuing improvements in drilling rig efficiency. The rig productivity measure starts with an estimate of crude and natural gas output from new wells in a region during their first month in production. The rig productivity (calculated separately for oil and for gas) is the new well output divided by the number of drilling rigs in the region.We will look at some of the regional data in the report in future episodes in this series but this time we have compiled two tables that summarize the production and rig productivity data provided in the report.
Table #1 below shows a summary of the production forecast data in the initial report for October 2013. The table is divided into two parts – the top half is for oil and the bottom half is for gas. Taking the oil data first, there are 8 column headings – one each for the production basins, a total column (orange box) and a monthly change column (light blue box). For each basin the table has three months worth of data extracted from the DPR. The data shows estimated monthly oil production in Mb/d for each basin that the EIA forecast. The forecast is based on prior month well data published by State agencies, current and prior month well drilling counts and average production from new and existing wells. Because production data reported by states can be significantly lagged, DPR uses rig count data along with trends in drilling productivity to make estimates of oil and gas production where data are not yet available. Since existing EIA monthly production reports have a three month lag the information in the DPR is more current than previously available – although likely subject to adjustment. The DPR provides history back to 2007.
Source: EIA and RBN Energy (Click to Enlarge)
The oil data shows that production in the Eagle Ford basin (red box) is expanding at a rate of over 25 Mb/d per month from 1045 Mb/d in September 2013 to 1093 Mb/d in November with Bakken production (brown box) expanding at similar rates, while the Permian basin is expanding more slowly (2 Mb/d per month – green box). The overall six-basin production estimate for November 2013 is 3.7 MMb/d (Total Oil column in the table) representing more than 50 percent of the latest published EIA total US crude production of ~7.5 MMb/d (July 2013). In the final column of the table we show the forecast monthly change in total production for all six basins, which is around 60 Mb/d for the latest three months in the DPR.The bottom half of Table #1 shows the identical summary for natural gas production in the six basins in MMcf/d. The total gas production in the six basins is expected to reach 34.2 Bcf/d in November – up 0.4 Bcf/d from October (Total Gas column). The two largest gas basins are the Marcellus (purple box) and the Haynesville (light green box) – with the former expected to produce 12.6 Bcf/d in November 2013 – just under double the Haynesville estimate of 6.6 Bcf/d (note the data in the table is in MMcf/d). Natural gas production in the Permian and Eagle Ford basins is higher than the Bakken because the former have more infrastructure to deliver associated gas from oil production to market .

Source: EIA and RBN Energy (Click to Enlarge)
Table #2 above is a summary of drilling rig productivity data for each of the six basins. The data is an estimate of new well production (during the first month of production) divided by the rig count. The layout of the table is similar to Table #1 with three months of data for each basin – oil at the top and gas at the bottom. The data shows that oil rig productivity is improving in all the basins except the Permian (dark green box) that is basically flat. Estimated Bakken rig productivity (brown box) jumped 23 Mb/d between October and November, but the average of all basins increased by only 7 Mb/d (blue shaded monthly change column). Estimated gas rig productivity increases in every basin except the Niobrara (pink box) in November. Marcellus rig productivity was up by 160 Mcf/d in November over October compared to the average for all 6 basins of 29 Bcf/d (purple box).The new DPR report provides a compelling gauge of US oil and gas drilling productivity in a more timely form than we have previously had access to. The data shows production continues to increase in the main shale and tight oil basins. Much of the improvement is due to drilling efficiency and new well productivity, rather than an increase in the number of active rigs. In the next episode in this series we will look more closely at the data provided for specific basins as well as the impact of older declining production on the overall trends.
0 comments:
Post a Comment