Sandy Fielden RBN 2013
The CME natural gas futures market has been trading in a narrow 40 cent range between $3.40/MMBtu and $3.80/MMBtu since the end of the summer. The onset of winter and the first storage withdrawals last week (according to EIA) have done little to jump start prices. The prompt Henry Hub futures market closed at $3.702 yesterday (November 21, 2013). The dominating story remains increased supply from new production. Today we look at how supplies are weighing on spot prices and futures market speculation.
This year has been a pretty unexciting one for the natural gas market so far. CME NYMEX Henry Hub futures prices reached $4.40/MMBtu in April, which turned out to be their high of 2013 so far, after a colder than normal start to the year, before falling to a low of $3.25/MMBtu in August when summer temperatures did not increase demand significantly. Prices recovered to $3.82/MMBtu in October during an early cold spell but fell back to $3.44/MMBtu in November as milder weather returned – recovering to $3.70/MMBtu in the past week on colder forecast temperatures. But we have not seen the record low prices of 2012 when gas dipped close to $2/MMBtu and there has not been a sustained recovery above $4/MMBtu as many market analysts expected. Since the end of the summer prices have been stuck in a 40-cent range between $3.40/MMBtu and $3.80/MMBtu.
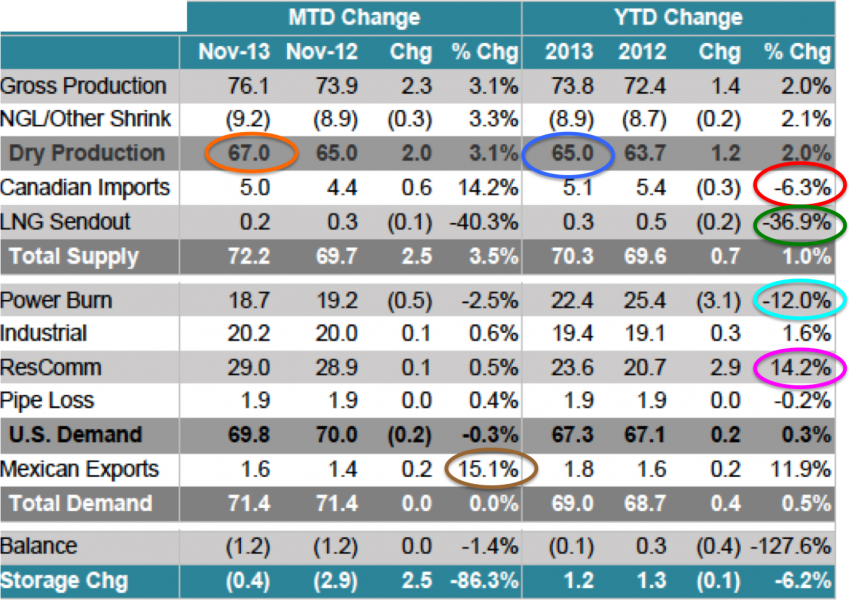
Source: Bentek (Click to Enlarge)
Looking at monthly supply/demand data from our friends at Bentek we can see that the dominant theme in the market remains growing supplies. The table above shows the month and year to date US supply/demand balance. Dry gas production in the US continues to increase – up by 1.2 Bcf/d to 65 Bcf/d in the year to October (dark blue circle) and another 2 Bcf/d so far in November to 67 Bcf/d (orange circle). As domestic production continues to grow – especially in the Northeast Marcellus basin, the natural gas distribution network is being rearranged to match new supplies to demand. In the national supply picture those changes show up in the 6.3 percent decline in Canadian imports versus 2012 (red circle) and the 37 percent reduction versus 2012 in LNG imports (dark green circle – “sendout” meaning sent inland from an import terminal). On the demand side, natural gas prices remained high enough relative to coal to discourage generators from large scale switching to natural gas . That coupled with a mild summer led to a 12 percent reduction in power burn versus 2012 (light blue circle). Nearly all of that reduced power burn demand this year (3 Bcf/d) was replaced by a 14.2 percent increase in residential and commercial demand in 2013 over 2012 (magenta circle). Despite much discussion of new industrial demand to suck up lower priced natural gas, the majority of these projects are still a few years away so industrial demand has been flat this year. Helping to soak up increased supplies have been exports across the border to Mexico, which continue to increase – up 11.9 percent this year over last and 15.1 percent so far in November 2013 (brown circle).
The buoyant supply picture has kept the lid on the market’s price expectations. The futures market has also seen lower price expectations this year than in the recent past. The chart below shows CME natural gas futures data over the past four years. The blue line is a monthly average CME Henry Hub futures market close price from December 2010 to present. Shooting off from that underlying line are four forward curves for dates around November 19 in 2010 (brown line), 2011 (green line), 2012 (red line) and 2013 (orange line). Recall that forward curves represent current futures market sentiment about the value of forward deliveries – they are not a price forecast. Looking at the right hand end of the top and bottom curves, you can see that the high price on the November 2010 curve is $7.36/MMBtu (for December 2022 delivery) and the November 2013 high price is $1.42/MMBtu lower at $5.94 (for December 2025 delivery). These highest prices on the forward curve – usually the furthest point out into the future, have been getting lower every year for the past four years and they fell faster in 2013 than prior years (black dotted arrows on the chart). This means market sentiment that natural gas prices will increase in the future has become less bullish every year for the past four years – a trend that accelerated this year.

Source: CME Data from Morningstar (Click to Enlarge)
With spot and futures prices dampened by the rosy supply picture the natural gas futures market is losing its following among speculators. That follows a trend over the past few years where lower price volatility has discouraged physical trading. Low price volatility is also impacting futures transactions because speculators in financial markets are attracted to commodities with big price swings. With forward prices weaker and increased supply keeping the lid on volatility, opportunities for speculators to profit from sharp price moves are drying up. The chart below shows CME NYMEX prices (red line) and total open interest (blue shaded area) so far this year. Open interest is a measure of “open” futures contracts i.e. contracts held for future sale or exercise. High open interest generally indicates increased speculation by financial players – hoping to profit from price volatility by holding open positions longer. The chart shows that between February and April 2013 there was a run up of open interest from 1.2 MM contracts to 1.6 MM contracts as speculators piled into the market expecting a strong recovery in gas prices this year. However, once prices began to fall and did not recover in the summer the open interest began to fall as speculators headed for the exits. Continued decline in open interest suggests that speculators do not have high hopes for a winter natural gas price spike this year.

So far 2013 has not proven comforting for natural gas producers because prices stayed below $4/MMBtu for the most part. Increased production has kept the lid on prices. Power burn was down this year versus last and industrial consumption has yet to pick up significantly. Exports to Mexico remain the bright spot for demand. Supplies from Canada and LNG imports are being pushed out by increased domestic production. Lower price sentiment appears to be set in and the lower expectations of future prices as well as falling open interest suggest that financial markets do not expect a strong recovery in gas prices any time soon. That is good news for consumers of course and for those industrial project planners keeping their fingers crossed for continued low gas prices.
0 comments:
Post a Comment